Trading Ideas to Help You Get Started with Your Bot

MORITZ PUTZHAMMER
25 March 2021 • 9 min read

Table of contents
Hello, Creator! Today we’re going to discuss some trading ideas and indicators to help push you one step closer to creating your first bot. We understand better than most that creating a trading bot is by no means an easy feat, we’ve been there ourselves so we’re in a great position to push you in the right direction.
With that in mind, let’s get started with some knowledge that you can implement into your strategy right away.
Using volume as an indicator - OBV (On-Balance Volume)
Trading volume is a very important factor that you must keep in mind when executing trades. It doesn’t matter if you are trading manually or automatically via trading bot - volume will have an effect on the success of your trades. Volume simply measures the amount of a certain cryptocurrency that is traded on an exchange in any given period of time. Volume is important because it can be used to confirm a trend direction. We’ll explain how it can be interpreted now.
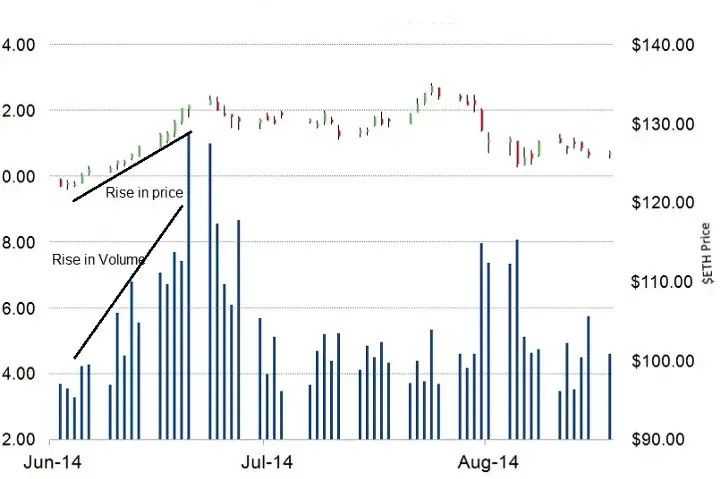
If the price of the cryptocurrency is going up and the volume is going up too, it shows that there is something pushing the price up. Usually, external factors like positive news trigger this. This also indicates that there is a lot of buying interest - basically it’s a confirmed uptrend.
When a cryptocurrency price goes up but the volume is decreasing, this indicates to us that traders are undecided on whether they want to buy that cryptocurrency. This indecision could arise when there are no psychological or fundamental elements to influence the wider community of investors (think news, project developments or events like the Bitcoin Halving). This could also indicate a trend change.
If the price is decreasing and the volume is increasing then we see that factors are driving the trend down, there is obvious selling interest there and it could mean there is a longer downtrend.
Finally, when both the price and volume decrease, we see traders are undecided on whether to sell the cryptocurrency or not. This happens when there is no external factor that can influence the wider investing community and that a trend change could be on the horizon.
Note: Volume, for the most part, also equals liquidity. When there is liquidity, it’s easier to get in and out of trades. With a low-volume cryptocurrency, you’ll find it hard to get in at your entry point and even worse, you might be stuck in a trade when you want out. So this is another important aspect to consider when looking at volume.
Let’s see how this looks on a chart.
Making the most of moving averages - Guppy Multiple Moving Average
Moving averages (MA) are one of the most simple and commonly-used lagging indicators that you will see in technical trading. A simple moving average is calculated by taking the average of a selected range of prices.
These are often employed as an indicator to compare where the actual price of a cryptocurrency is in relation to resistance or support on a chart. Essentially, when the price goes down or up and touches a MA line - we can assume that the price may stop and have a retrace in that moment. This is well visualized in the following chart:
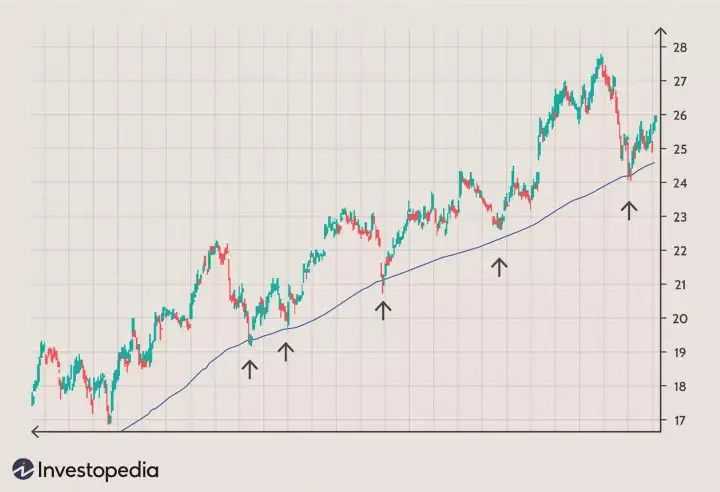
Looking at the above chart, you might be led to believe that trading with MAs is easy and that is because the above is a perfect market scenario.
As we all know, there is no ‘perfect’ scenario in cryptocurrency trading - it’s notoriously unpredictable and although MAs are decent tools, adding a simple moving average line alone will not cut it. But that is not to say you can’t use moving averages at all.
Enter Mr. Guppy.
Guppy Multiple Moving Average (GMMA)
Developed by prominent trader and finance columnist, Daryl Guppy, ‘The Guppy Multiple Moving Average’ takes your run-of-the-mill exponential moving average (EMA) and powers it up to 1000%.
What you do here is use twelve different EMAs with the goal of gaining a much clearer picture of the market behaviour. Six of these EMAs should be long term and six should be short term.
The periods you choose are up to you but a common strategy is the following:
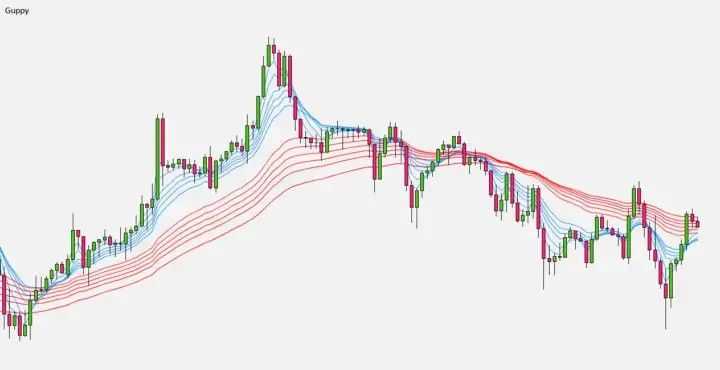
Long term periods: 3, 5, 8, 10, 12, and 15 (these are indicated by the six red lines in the following chart)
Short term periods: 30, 35, 40, 45, 50, and 60 (indicated by the six blue lines)
Generating buy signal ideas with GMMA
Although it looks intimidating, it’s really not so complicated.
When all the short-term EMAs cross above the long term EMAs - this confirms a bullish trend and should be interpreted as a buy signal. Let’s have a closer look at that chart to make sure you understand.
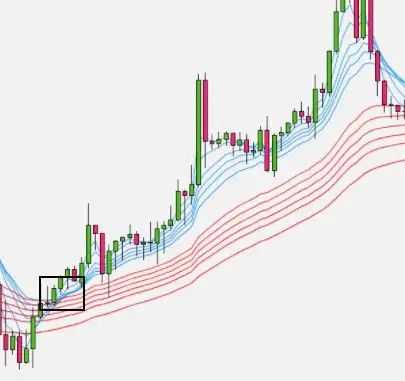
If a strong uptrend is occurring then the short-term EMAs will stay close to, but above, the long-term EMAs. If you observe this then it can be interpreted as a very bullish trend.
Generating sell signal ideas with GMMA
Conversely, when all the short-term EMAs cross below the long term EMAs - this confirms a bearish trend and should be interpreted as a sell signal. Let’s zoom in on the chart again to highlight that moment.
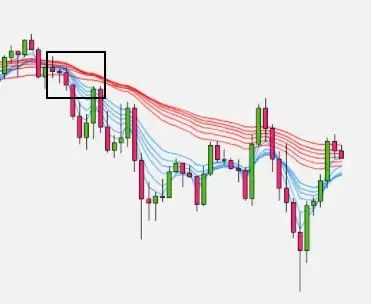
If a strong downtrend is occurring, then the short-term MAs will stay close to the long-term MAs, but will not cross. They will then begin to move lower which implies a continuation of the bearish trend.
Why is GMMA so useful?
There are a few reasons why GMMA has the upper hand over other moving average strategies.
- It allows traders a significantly better understanding of trend strength
- It allows for more precise analysis of trading activity and the environment around the trend
- It helps you to pinpoint and isolate trades
- It also helps to spot the best opportunities to get in and out of a position
If you are struggling with where to start - Guppy might be your best bet.
Bollinger Bands, Average Directional Movement Index (ADX) and RSI combinations
We have now gone over some singular indicators and how they can give you an edge when creating your first bot but a good bot requires a little more diversity and a combination of indicators can be highly profitable when you know what you’re doing so we’re going to detail some dos and don’t when combining indicators.
You may already be familiar with all of the following indicators but for those of us who are new to the game, I will quickly go over what they are.
Bollinger Band/ADX combo (no good!)
Bollinger Bands is a technical analysis (TA) indicator created by a Mr. John Bollinger who used it to glean a market’s volatility and identify oversold or overbought conditions. It essentially tells you when the market is loud or when it is quiet.
Average Directional Movement Index (ADX) is a more complex indicator which is used by traders to figure out the strength of an uptrend or downtrend. We won’t get too deep into the mathematics of the indicator but it actually comprises three formulas. That means ADX usually appears as three lines on a chart and helps your bot to assess if it should take the trade long or short (or if it should make the trade at all!
Combining these two might seem like a great idea at first. You might think that it’s the best way to detect a coming trend change but it is not.
As both of the above are trend-following, lagging indicators, it’s not particularly useful to combine them as the signals you will get are essentially the same. If you use two trend indicators, your bot might be led to believe that a trend is stronger than it is, giving it the go-ahead to make a trade while missing other important signals. This can be detrimental to your strat. In other worlds, the strategy becomes redundant.
Adding a different type of indicator will help get better results!
To rectify your problem, we just need to add another, different type of indicator, i.e. not a trend-following indicator. In this case, we’ll employ the universally-loved Relative Strength Index (RSI).
RSI is a momentum indicator and it’s used to measure the magnitude of recent changes in price to determine overbought/sold conditions. It’s also a leading indicator.
In our example, adding RSI to the strategy is very beneficial as it gives the bot another data point to pull from in order to make its decision. Now, the RSI will identify noticeable momentum changes while the ADX discovers trends and the Bollinger Bands acts as a volatility trend indicator.
Enter MACD ( having a MACD, SMA and RSI combination!)
Another popular indicator is MACD (Moving Average Convergence Divergence - it’s a mouthful, we know).
MACD
This indicator is another-widely used one. It is a trend-following momentum indicator that displays the relationship between two moving averages of an asset’s price.
So for our combination strategy, we are going to create a trio, a holy trinity if you like made up of MACD, SMA and RSI. This means we have two lagging indicators and one leading indicator. RSI in this strategy will identify potential reversal points in the trend and the two lagging indicators will confirm the signals!
That was all for combining indicators and of course, there is a lot more to learn. Going back to the beginning of the article - creating a cryptocurrency trading bot that is profitable is simply not easy and it requires a lot of trial and error.
Do swim against the current
If every trader in the world was employing the same strategy then no one would be making any money at all. That’s because the algorithm would be made redundant by overuse. Although observing successful traders and listening to their advice is never a bad thing (you can certainly learn a lot from them) it’s also so very important to get creative, the best algorithms in the world are those that are doing something different and capitalising on the fact that other traders are predictable
Wrapping up
At Trality, we offer our users the opportunity to make use of all the indicators highlighted in this blog post plus a lot more we didn’t mention. They can all be used to fine tune your ideal strategy.
Take a look at the table below to see which indicators on our intuitive Rule Builder and into which category they fit. Please note that many of these indicators fit into multiple categories.

(Please note that with the Python Code Editor, you can use a lot more indicators which you will find in our documentation.)
We’re constantly expanding the range of indicators which are available on Trality and we urge you to use the knowledge within this blog post to go and begin experimenting with different combinations. If you need some more inspiration then remember that great ideas become better when combined so why not go and join our active Discord community where you can chat, review and discuss ideas with like-minded people?
With our powerful backtester, you can perform unlimited backtests to see how your strategy performs. In addition, a new feature for the backtester when creating Python Code Bots, the Optimizer will allow you to automate the parameter optimization process. When writing your bot code, you simply define relevant parameters and their respective ranges that you want to be optimized to achieve the highest PnL, and let the Optimizer do its magic.
There’s absolutely no reason for you not to let your imagination run wild and try to come up with your next profitable trading idea using our suite of powerful tools.


