A Guide to Optimizing Crypto Trading Strategies

MORITZ PUTZHAMMER
01 June 2022 • 8 min read
Table of contents
You might think that the hard work is over once you've finalized your own unique trading strategy tailored to your individual investment goals. As seasoned traders will tell you, though, this is far from the truth. Crypto trading bots are automated, but they're not automatic, which means that they require periodic monitoring, especially during periods of increased volatilty. As a trader, you want to match your trading strategy to a particular market regime in order to optimize gains, or limit losses during a downturn, and so we've put together some ideas for adjusting your strategy based on a range of possible market conditions.
Ideas for reducing large drawdowns
Use the triple barrier method to manage orders with fixed risk per trade. The triple barrier limits losses with the inclusion of a stop-loss, but also closes the position after a certain amount of time to prevent the market from changing direction. In fact, we've written an informative guide on how to exit trades, i.e., closing positions. We put everything together in a simple trading strategy using the Trality Code Editor. All Python code is explained in a step-by-step manner.
Use trailing stop-losses to let winners run
Using a trailing stop-loss allow trend following strategies to keep winners open while also limiting the maximum loss. More information can be found in the Trality documentation for the trailing order type.
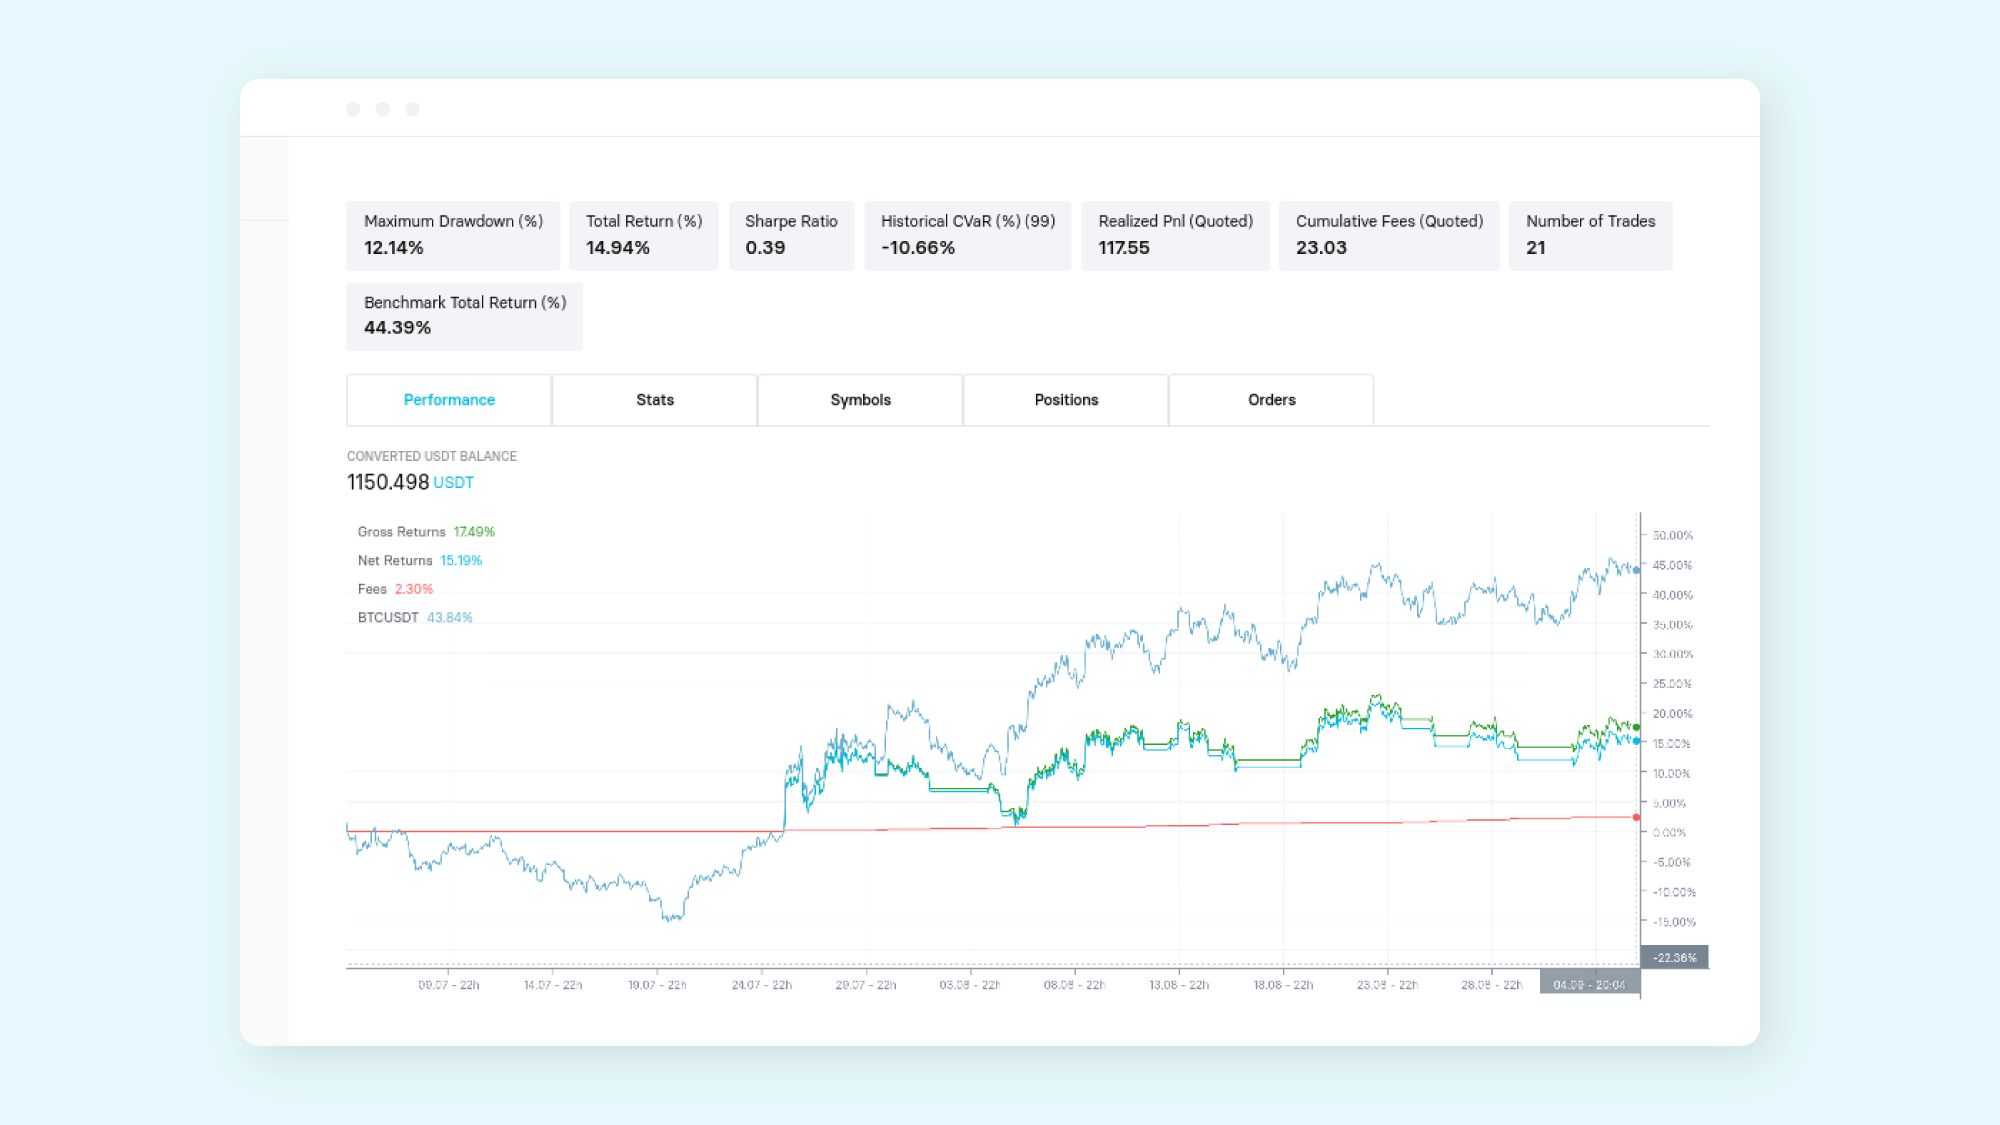
Below are the backtest results of a 1h EMA crossover strategy with 10, 50 period, respectively, and a 1d super trend. Positions are opened when the fast EMA is above the slow EMA and are then closed when the fast EMA is below the slow EMA. Even in a upward market, the strategy performs poorly.

Below is the same strategy but the position exit uses a trailing stop-loss placed 2.5% below market, with an increment of 2.5% to exit positions. The performance is much better both in terms of profits and maximum drawdown.
Fixing consecutive losing trades
One method that can improve a strategy that has both winning and losing streaks is to consider adding a cool down to prevent trading after a recent number of stop-losses. Strategies often target specific market conditions such as trends or ranges. When the strategy is working well, it is a sign that it is “over the gold” and likely will have a high winning percentage. A trend-following strategy might win 80% of the time in a bull market but only 20% in a bear market. By monitoring the recent win percentage, we can infer that the market conditions are not optimal for the bot and that it might be best to wait until market conditions look more promising. For a bot with an expected win rate of 80% when it is in the right market conditions, there is only a 4% chance of getting 2 losers in a row. This information can be useful in deciding how to trade the next signal.
Use a trend indicator on a longer time frame to measure long-term trend direction
A long-term trend is made up of many smaller trends, which is why understanding the “bigger picture” is important to a strategy's performance. Multiple time frame strategies can take advantage of longer-term trends to avoid large drawdowns and achieve a higher winning percentage.
A simple EMA crossover strategy has poor risk-adjusted trading results during bear markets. This is due to it looking for trends that likely don’t exist. Or, if they do, they do not last for very long.
The strategy performs well in up trends, but when the market is bearish it really struggles. This can be seen in both the PnL performance and the maximum drawdown.
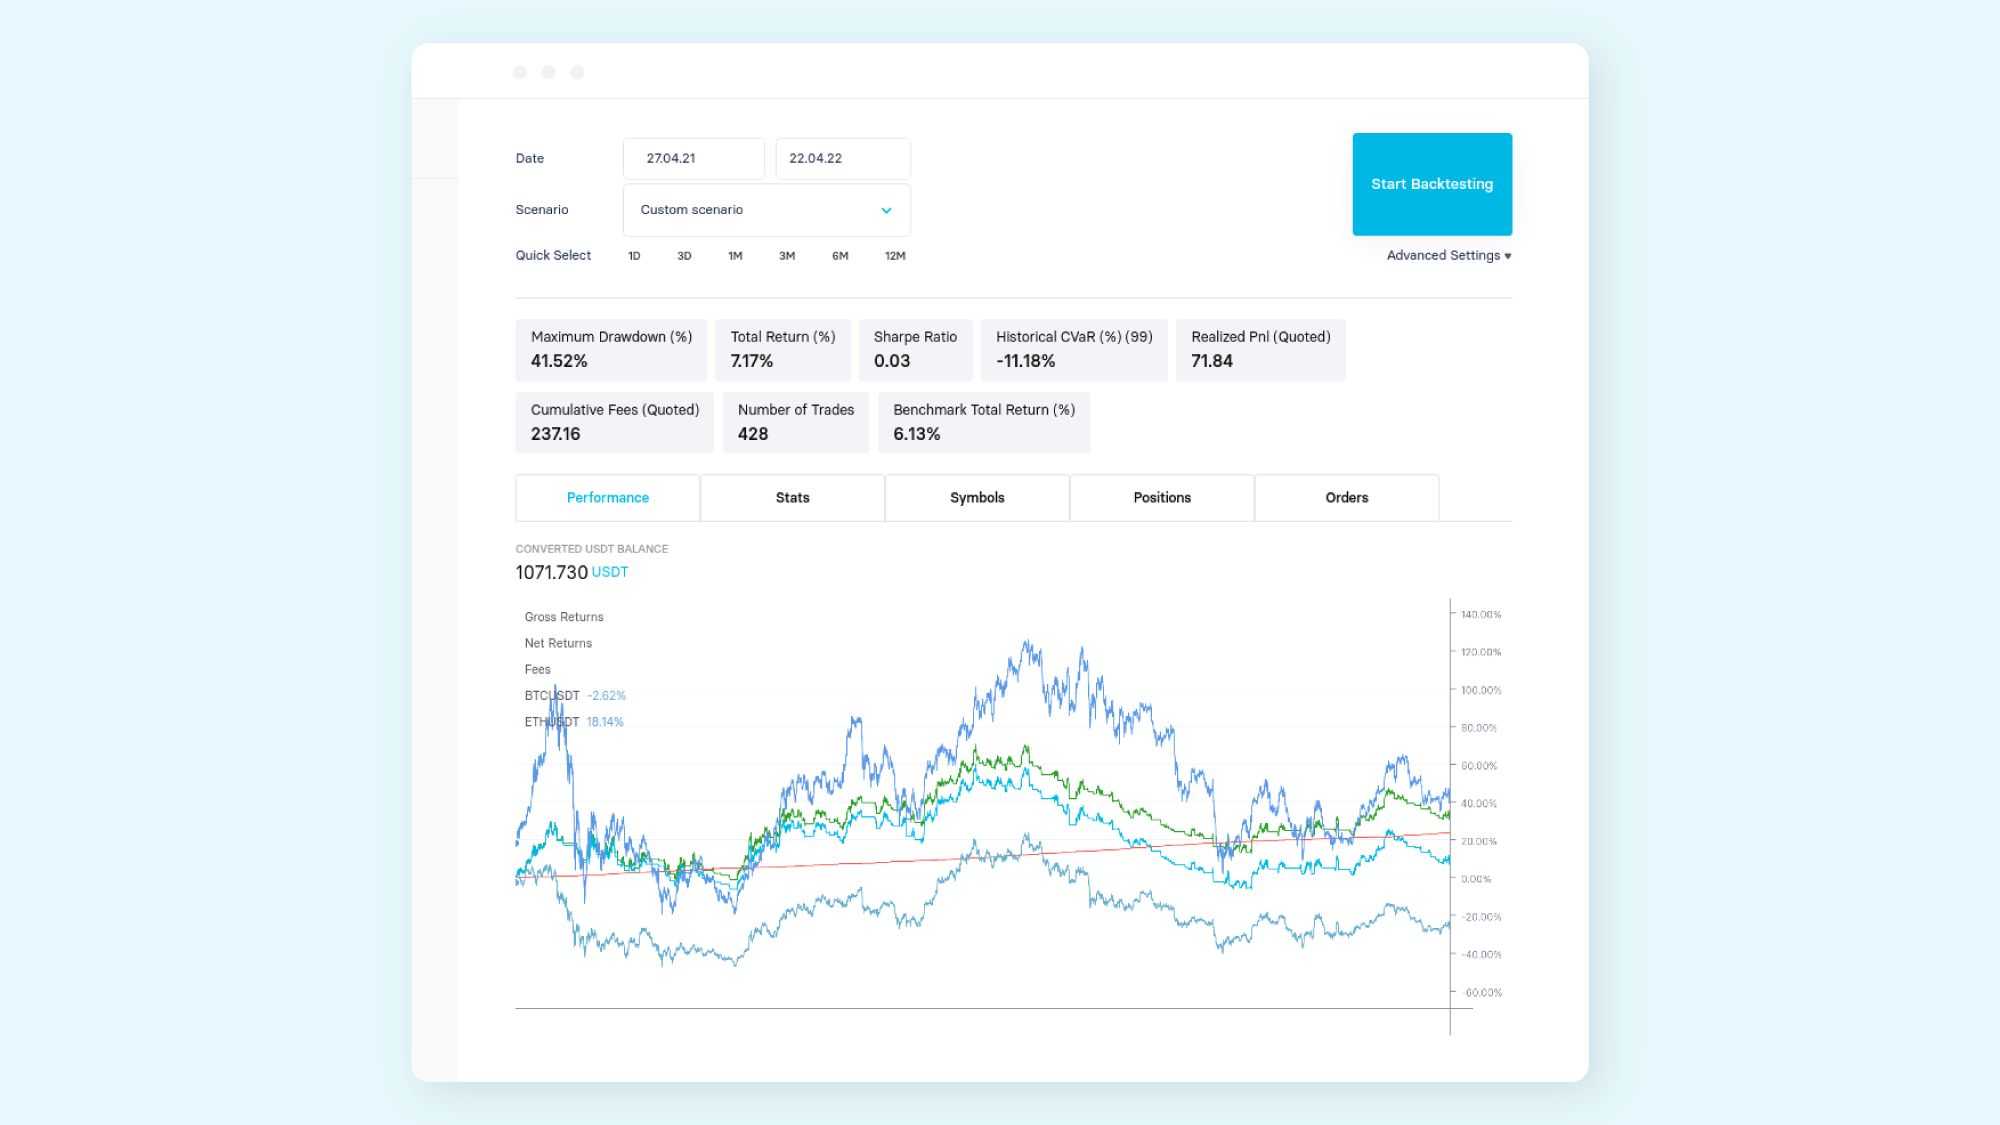
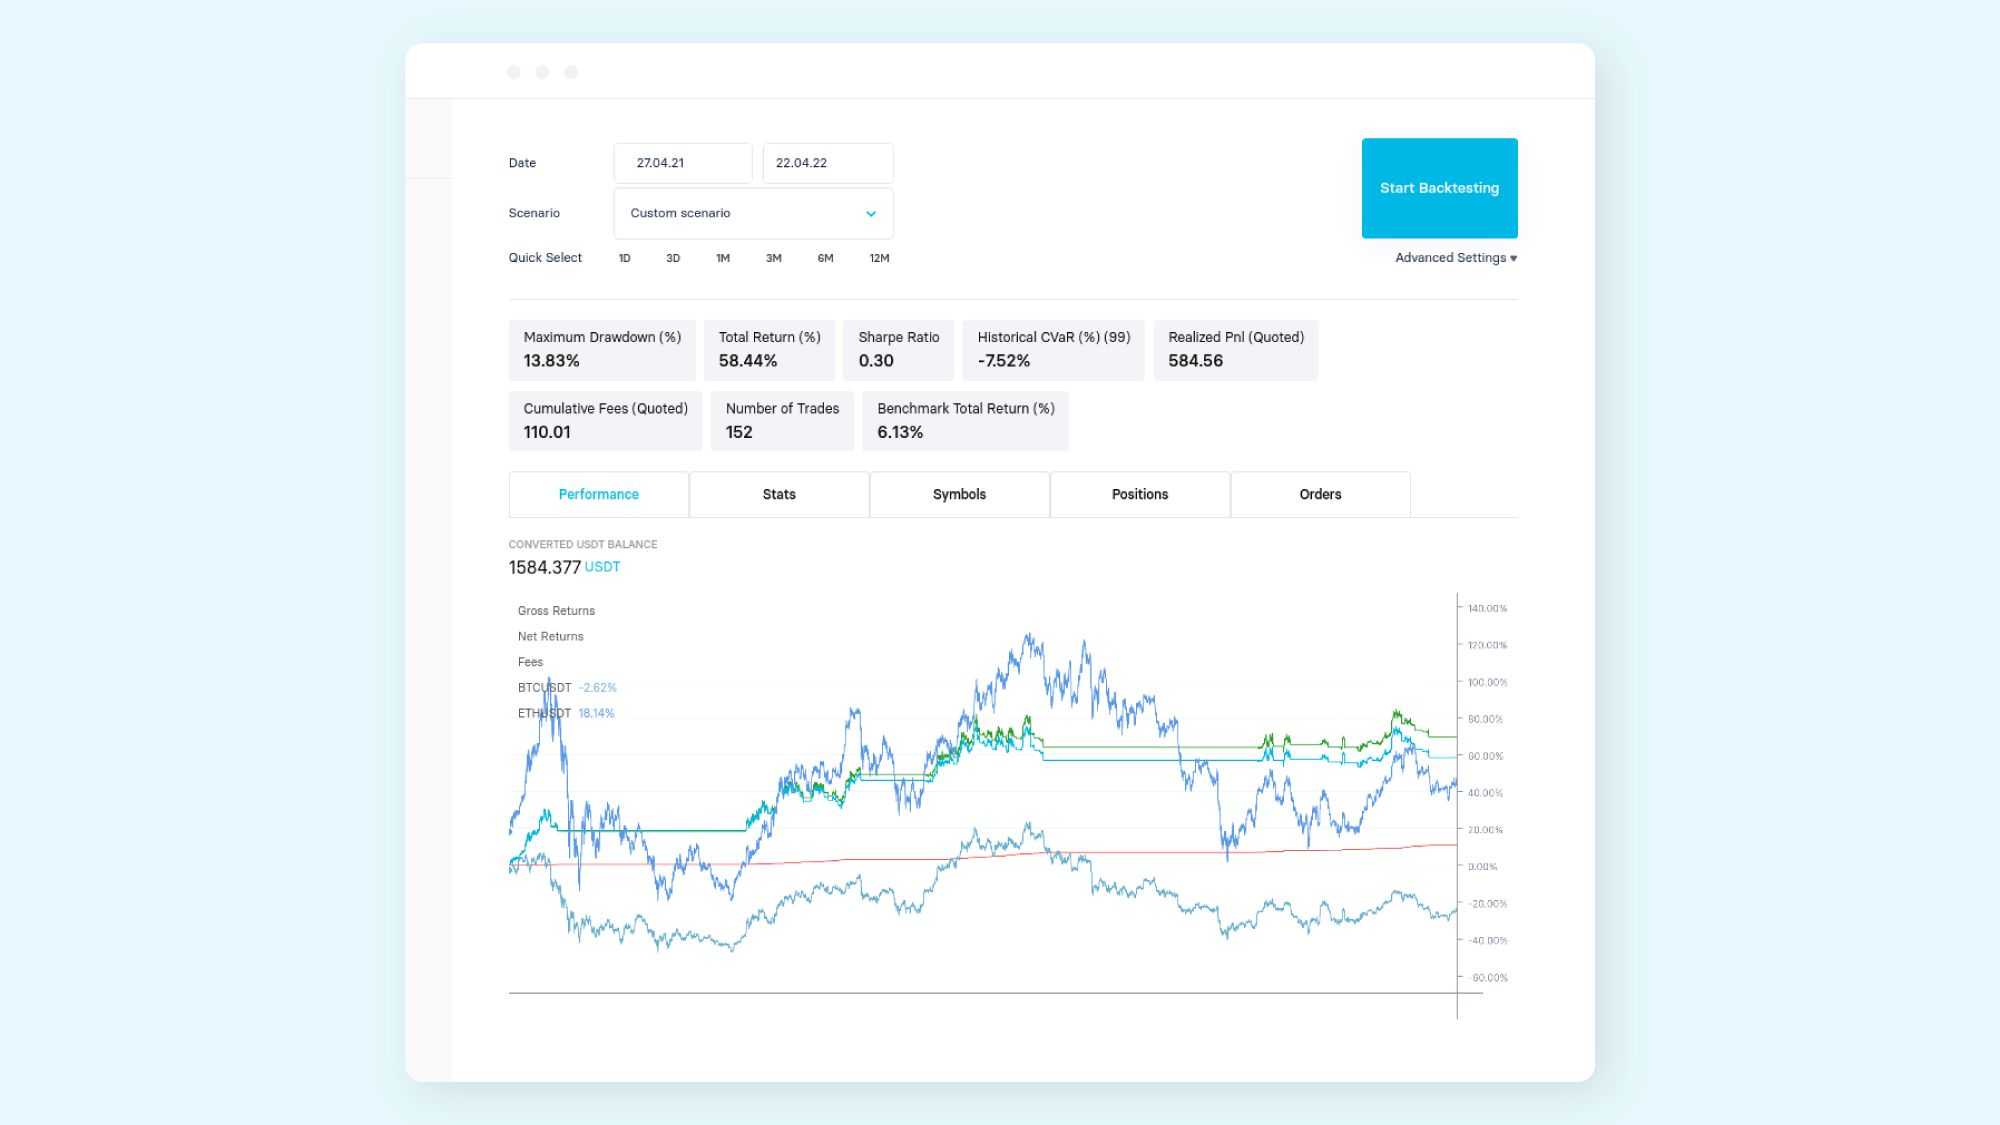
Adding a long-term (1d) super_trend indicator can significantly improve the bot’s ability to deal with long-term bear markets.
The bot above adds the use of a super_trend indicator within a 1 day handler to instruct the 1 hour handler what the longer-term trend is. The effect of this in backtesting is to significantly reduce the drawdown when the longer-term trend is bearish. The performance of the simple strategy measured by PnL/drawdown has improved from 0.1727 to 4.22, which is a significant increase.
Scale positions using Value at Risk (VaR) so risk is proportional to market volatility
Losses often occur during market crashes when volatility is obviously a lot higher than normal. It is beneficial to monitor the risk of the strategy using price covariance and current position and limit the strategy’s risk, not based on account balance but on the strategy’s total risk as estimated by VaR.
As the portfolio risk increases, the positions are reduced to keep the total risk within bounds.
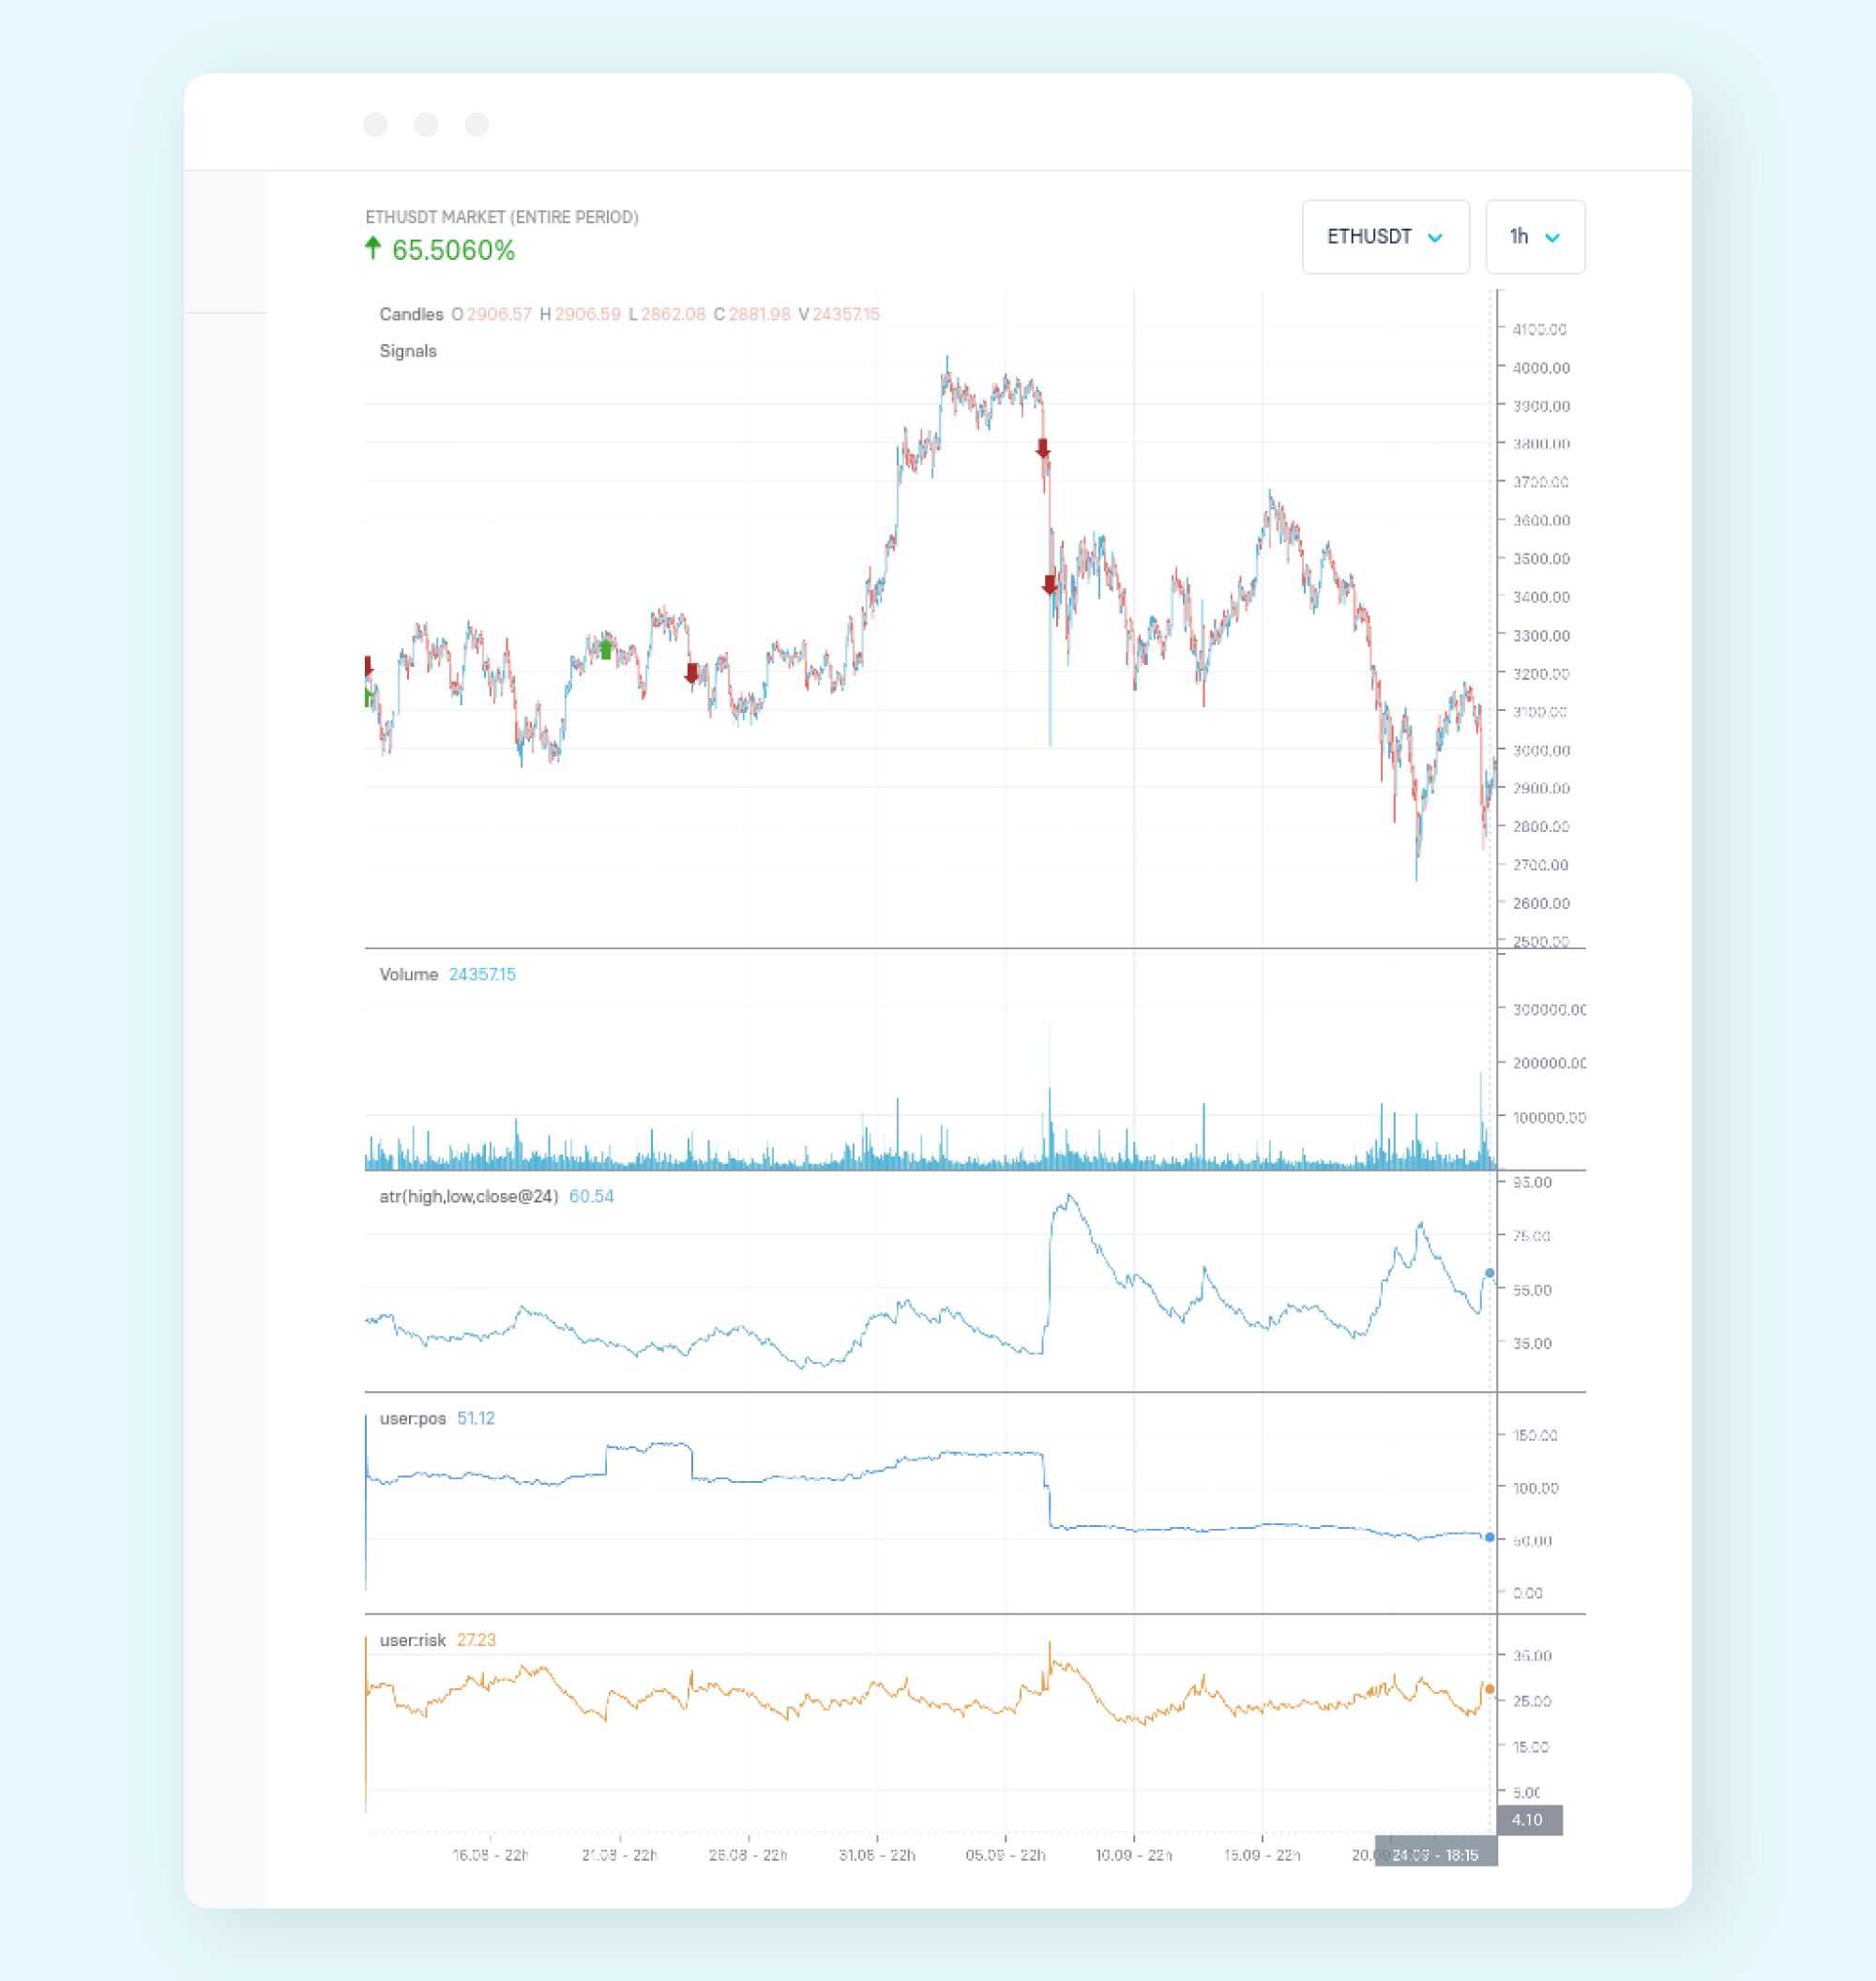
The important function is compute_portfolio_risk, which gives the expected volatility of the portfolio for the next day.
Using this portfolio risk, decisions can be made if the risk exceeds limits. In the case of the bot, we target a position size relative to the ratio of the risk and our target risk.
This will naturally increase positions when volatility is low and decrease position size when volatility is high.
Asset Selection
Another important part of the strategy optimization process is asset selection, which is also closely related to market regime because some assets have a tendency towards one market regime versus another. Coins like SHIB and DOGE can have high volatility and have historically had strong trends. Coins like PAXG have very different dynamics and tend to be much more stable, with higher noise and lower volatility. BTC and ETH have most of the volume in the market and tend to trend.
While each coin has its own dynamics, similar coins also tend to have similar dynamics. A profitable strategy with one coin will likely also make money trading coins with high correlations. When looking at correlation across many assets, the correlations tend to group into clusters. A specific trading strategy will likely have similar trading performance for all assets within a cluster. You can then use these clusters to form baskets of assets.
Some strategies, such as trend-following strategies, prefer assets that tend to trend. Mean reversion strategies such as Bollinger Band strategies prefer assets that tend to range. Choosing the appropriate assets for a given strategy is important.
Final Thoughts
Trading strategies can be considered tools in a toolbox, with each one (or a combination thereof) specifically designed to profit from specific market regimes. Each market regime has characteristics that describe the nature of the price dynamics. As a trader, it's crucial to leverage the trading tools at your disposal and pair them with the appropriate market regimes in order to achieve the best results. This isn't a set-it-and-forget-it approach, but an ongoing process that requires periodic monitoring as well as fine tuning based on your goals and the current and anticipated market conditions.


